Posts

Showing posts from December, 2024

How to Write and Understand a Dynamics CRM Plugin

Image
 Here’s a sample plugin code in Dynamics CRM written in C#, along with a detailed explanation of each line. This plugin will update the "Description" field of an entity whenever a record is created. Sample Plugin Code using System; // For basic .NET types using Microsoft.Xrm.Sdk; // Provides key interfaces for CRM plugin development using Microsoft.Xrm.Sdk.Query; // For performing queries against CRM data namespace SamplePluginNamespace // Custom namespace for the plugin { public class SamplePlugin : IPlugin // Plugin class implementing the IPlugin interface { public void Execute(IServiceProvider serviceProvider) { // STEP 1: Retrieve the context of the plugin IPluginExecutionContext context = (IPluginExecutionContext)serviceProvider.GetService(typeof(IPluginExecutionContext)); if (context.MessageName != "Create" || context.St...

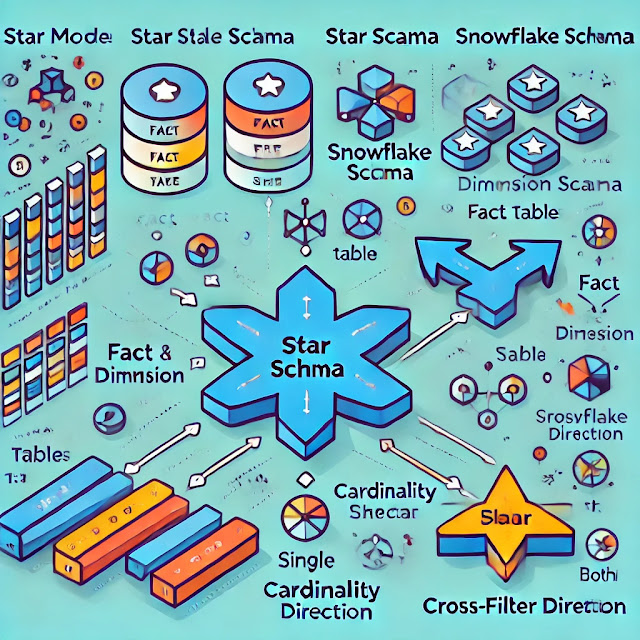
Exploring the Many Faces of Power BI Data Models: Star, Snowflake, and Galaxy Schemas

Image
In Power BI, a data model is the foundation of your analysis. It organizes the data, establishes relationships between different tables, and allows for aggregation, filtering, and modeling of your business logic for effective reporting. The way your data model is set up has a significant impact on performance, usability, and the quality of insights you derive from your data. Below are the types of data models you will typically use in Power BI, their usages, and how to implement them: 1. Star Schema Usage: The star schema is one of the most commonly used data modeling techniques for creating a simplified and highly efficient data model. It’s great for reporting and business intelligence because it is intuitive, improves performance, and avoids complex joins. Structure: The model consists of a central fact table connected to multiple dimension tables , forming a structure that looks like a star. Fact Table: Contains business measurements, usually quantitative data such as sale...

Breaking Down Power BI Visuals: Which Charts Work Best for Your Data?

Image
A report is a collection of interactive visualizations and data representations, built on top of datasets, to convey specific insights and trends. It’s a comprehensive tool used for analyzing and presenting data in a way that supports decision-making. It can contain multiple pages (similar to a workbook in Excel). Visuals in a report are interconnected, meaning interactions with one visual can affect others (e.g., filters or highlight effects). Users can explore, drill down, and filter the report data for deeper analysis. Type of Report Structure : Visuals : Visualization of semantics model data. Elements : Provide visual interest but don't use semantic Model data. elements include Textboxes, Buttons, Shapes and Images. Difference Between Visuals and Elements in Power BI Aspect Visuals Elements Definition Interactive representations of data (e.g., charts, tables). Any component within the report, including visuals, slicers, images, etc. Purpose To display, explor...

Collaborate Smarter: Understanding Power BI Workspaces

Image
Power BI is one of the popular business intelligence (BI) tools used by several organizations and companies for analytics purpose. Workspaces are the foundation of the Power BI service.  Workspaces in Power BI are collaborative environments where teams can create, share, and manage their reports, dashboards, datasets, and other Power BI content. They act as containers for organizing content and defining access levels for different users. Workspaces are Power BI containers which contains dashboard, reports, datasets, Apps and others. There are two types of workspaces: My Workspace : A personal workspace for individual users.  Used for personal experimentation and non-collaborative work. Shared Workspaces (App Workspaces) :  Collaborative spaces for teams or departments.  Allows multiple users to contribute, manage, and view shared content. Technical Uses of Workspaces  1.  Collaboration : Teams can co-author reports and dashboards. 2.  Content Manage...

Difference Between Measure and Calculated Table in Power BI

Image
  Aspect Measure Calculated Table Definition A measure is a DAX formula used to perform dynamic, context-based calculations (e.g., sums, averages) within a Power BI report. A calculated table is a table created using DAX that stores intermediate or transformed data directly in the data model. Usage Context Used for aggregations and calculations in report visuals based on filters or user selections. Used for creating new datasets, such as role-playing dimensions, custom relationships, or pre-defined groups of data. Storage Measures do not store data ; they calculate results dynamically at runtime. Calculated tables store their data in the Power BI model. Performance Lightweight; calculated at runtime but can impact performance in large or complex data models. Can increase the size of the data model, affecting overall performance and resource usage. Creation Process Created as DAX expressions in the Fields pane , often within the same table. Creat...

Unlocking Insights: Mastering Calculated Tables in Power BI

Image
After the release of Power BI Desktop, calculated tables were integrated to give users advanced modeling capabilities. This provided a way to create intermediate data structures directly within the Power BI interface, enhancing the ability to manipulate and organize data without altering the source systems. Calculated tables are ideal for intermediate calculations or data that needs to be stored as part of the data model instead of being calculated on the fly or retrieved as query results. Introduced in Power BI, they fulfill the demand for advanced data modeling without dependency on external sources. By leveraging Data Analysis Expressions (DAX), calculated tables allow users to create new tables within a Power BI model, derived from computations or transformations of existing data. Calculated tables in Power BI are versatile and can address several specific modeling needs: 1.  Date Tables :      Automatically generating or customizing date tables for time in...

Model-Driven Apps Command Bar: A Guide to PrimaryControl and SelectedControl

Image
The command bar in Power Apps model-driven apps is a toolbar that lets users perform actions. You can customize it by adding buttons that run your own logic, either using Power Fx or JavaScript. This logic can work with a single data record or multiple records, depending on where the button is placed. The CrmParameter in the ribbon of Dynamics CRM (now Dynamics 365) is a special parameter used in the ribbon's button definitions or commands. It provides contextual information about the entity or record within the CRM system when the ribbon button is clicked. Purpose of CrmParameter CrmParameter is primarily used to pass specific CRM-related data to a custom JavaScript function, URL, or command action. It helps in retrieving dynamic data based on the current context, such as entity IDs, selected records, or even the page's user interface settings. 1. PrimaryControl Definition : Refers to the main form context or entity record currently being displayed or interacted with in the ap...

A Deep Dive into Real-Time Intelligence

Image
In analytics, intelligence means using advanced methods to analyze data and create useful insights. This involves finding trends, patterns, and relationships in the data to help make decisions and plan strategies. It turns raw data into valuable and meaningful information. Real-Time Intelligence is a modern approach that uses data analytics and advanced tools to provide the most up-to-date and relevant insights instantly. It is widely used in areas like finance, crime prevention, and cybersecurity, helping organizations make timely and informed decisions. Data analytics (DA) is the process of examining data sets to find trends and draw. Data visualization is the practice of translating information into a visual context, such as map or graph. Fabric's Real-Time Intelligence solution offers a complete system for analyzing data in real time, seamlessly integrating with other Fabric services. It is highly efficient and can manage data of all sizes, from a few gigabytes to massive datas...